.png?width=225&height=57&name=Untitled%20design%20(20).png)
Summary
- Your Total Recordable Incident Rate (TRIR) has likely plateaued because standard safety levers (training, audits, incident reviews) are lagging activities that react to events that have already occurred.
- Shift focus from tracking activity-based leading indicators (e.g., training completion) to condition-based ones, especially Serious Injury and Fatality (SIF) precursor events that signal high-severity risk.
- A healthy reporting culture will initially cause near-miss reports to increase. This is a positive sign that you are gaining visibility into previously hidden risks before they become recordable injuries.
- Avoid common mistakes that artificially lower TRIR without improving safety, such as "denominator gaming" with work hours, over-relying on case management to reclassify injuries, and using rate-based safety incentives.
Sustained TRIR reduction requires closing the visibility gap between periodic audits by using continuous detection systems like AI-powered analysis of existing camera feeds to identify and act on hazardous conditions in real time. A practical way to start is by using existing infrastructure in a focused pilot, then measuring success through response times and trends in repeated deviations.
Your Total Recordable Incident Rate (TRIR) is more than a number on an OSHA 300A form. It's the metric that shows up on your ISNetworld profile, your Avetta scorecard, and your client prequalification documents. It can determine whether you win the next contract or spend months explaining why your safety performance isn't where it needs to be.
You've already pulled the standard levers. You've refreshed the training, increased PPE audit frequency, and held countless incident review meetings. Yet your TRIR has flatlined, oscillating within the same frustrating band year after year.
Your program hasn't stalled because your team stopped caring. It's stalled because TRIR is a lagging metric that only counts what already became a recordable injury. The standard playbook operates downstream of the moment risk actually forms, leaving you perpetually reacting to the past.
This guide explains why that playbook plateaus and what to do instead. We'll cover the shift from lagging metrics to leading indicators, the importance of analyzing precursor conditions, and how continuous detection provides the visibility needed to finally break the cycle and drive your TRIR down for good.
What TRIR Measures and What It Misses
The Total Recordable Incident Rate (TRIR) is an OSHA safety metric that measures how often recordable workplace injuries and illnesses occur per 100 full-time employees in a given year. It's a standardized way to normalize safety performance across companies of different sizes.
The formula is straightforward:
TRIR = (Number of Recordable Incidents × 200,000) ÷ Total Hours Worked
- Number of Recordable Incidents: The count of all work-related injuries and illnesses that require medical treatment beyond first aid, or result in days away from work, restricted work, or loss of consciousness.
- 200,000: The baseline hours for 100 full-time employees working 40 hours per week, 50 weeks per year.
- Total Hours Worked: The actual number of hours all employees have worked during the year.
For example, if your facility had 5 recordable incidents and employees worked 500,000 total hours: TRIR = (5 × 200,000) ÷ 500,000 = 2.0. 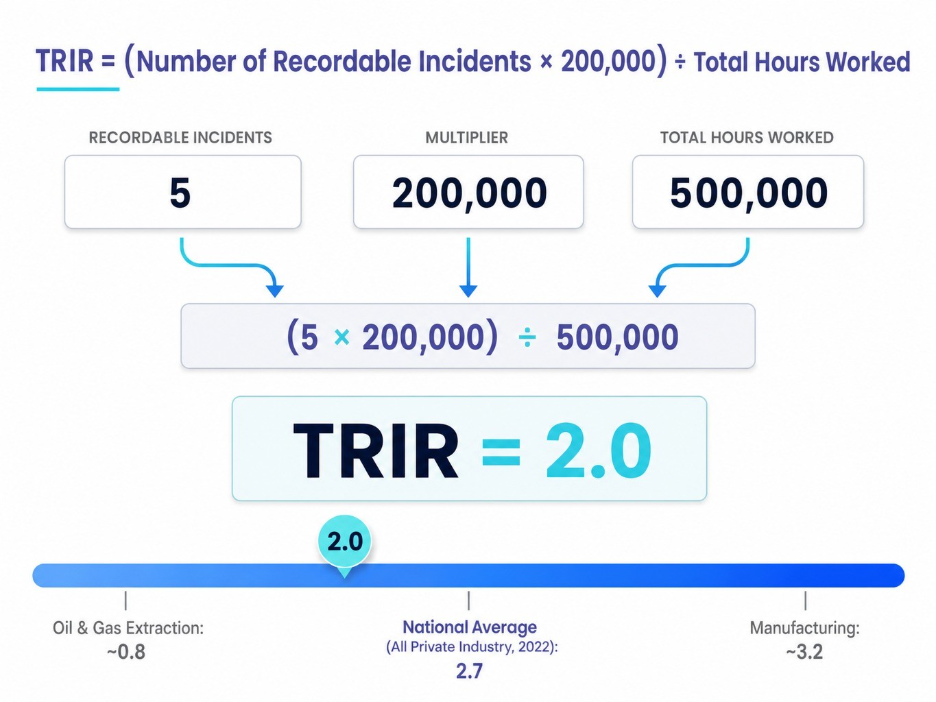
A worked TRIR calculation with industry benchmarks for context.
According to the U.S. Bureau of Labor Statistics (BLS), the national average TRIR for all private industries was 2.7 in 2022. However, "good" is highly industry-specific:
- Construction: ~3.0
- Manufacturing: ~3.2
- Oil and Gas Extraction: ~0.8
But here's the metric's critical limitation: TRIR tells you how often injuries happened, but nothing about how severe they were, how close you came to a fatality, or whether the conditions that caused them still exist on your site right now. A small contractor with 25 employees (approx. 50,000 hours) can have a TRIR of 0.0 one day and 4.0 the next from a single minor recordable, demonstrating the statistical volatility that makes it an unreliable sole indicator of safety health.
TRIR vs. DART Rate vs. LTIR: Which Metric Tells You What
TRIR, DART rate, and LTIR (or LTIFR) each measure a different slice of your injury data; confusing them leads to misallocated safety resources.
|
Metric |
Full Name |
What It Counts |
Formula Multiplier |
When to Use It |
|
TRIR |
Total Recordable Incident Rate |
All OSHA-recordable injuries and illnesses. |
200,000 |
To benchmark overall incident frequency against industry peers. |
|
DART |
Days Away, Restricted, or Transferred Rate |
Only recordable cases that resulted in lost workdays, restricted duties, or job transfer. |
200,000 |
To measure the frequency of more severe injuries that impact staffing. |
|
LTIR |
Lost Time Incident Rate |
Only cases with days away from work. Some jurisdictions use 1,000,000 hours. |
200,000 or 1,000,000 |
To track the frequency of the most severe non-fatal injuries. |
If your TRIR is high but your DART rate is low, it suggests most of your recordables are medically treated without impacting work status; a frequency problem. But if your DART rate is high relative to your TRIR, you have a severity problem, not just a frequency problem.
Why Training Refreshers, PPE Audits, and Incident Reviews Plateau
Every article on TRIR reduction recommends the same things: better training, more audits, near-miss reporting, and safety committees. These aren't wrong; they are necessary components of any functional safety management system. But they are also what most organizations with a plateaued TRIR have already been doing for years.
The problem is structural. All these levers operate after risk has already materialized into an observable event:
- Training teaches people what to do, but it doesn't detect whether they are actually doing it at 2 AM on a double shift.
- PPE audits confirm compliance at the moment of the audit, but say nothing about the 23 hours and 50 minutes between them.
- Incident reviews analyze what already went wrong, but they can't prevent the next event that has a different root cause.
Consider a manufacturing facility that ran monthly toolbox talks, quarterly PPE audits, and weekly incident reviews for three years. Their TRIR oscillated between 2.1 and 2.8, never trending consistently downward. Why? Their safety program was optimized to respond to recordable events, not to detect the precursor conditions like blocked egress paths, improper lockout/tagout sequences, or fatigue-related posture changes that precede them.
This aligns with modern critiques of Heinrich's Triangle. Research from organizations like the Campbell Institute has shown that the precursors to Serious Injuries and Fatalities (SIFs) are often entirely different from the precursors to the high-frequency, low-severity incidents that drive TRIR. Focusing only on reducing minor cuts and strains does not automatically prevent a catastrophic failure.
Leading Indicators and SIF Precursor Analysis:
Measuring What Matters Before It Becomes a Recordable
Leading indicators measure the presence and quality of safety activities before an injury occurs. They are the only metrics that give you the ability to intervene before your TRIR moves. But not all leading indicators are created equal.
Why Activity-Based Leading Indicators Are Not Enough
Most organizations track activity-based leading indicators: training completion rates, audit frequency, safety observation counts. These metrics create a false sense of progress. A site can have 100% training completion and still have workers bypassing lockout/tagout procedures because the training content doesn't match the actual task conditions on the floor.
These indicators tell you if the safety work was done, not if the risk was actually reduced. If your leading indicator dashboard is all green but your TRIR hasn't moved in 18 months, you are measuring activity, not outcomes.
SIF Precursor Events: The Injuries That Didn't Happen Yet
A more powerful approach is to focus on condition-based indicators, specifically Serious Injury and Fatality (SIF) precursor events. A SIF precursor is an event or condition that, under slightly different circumstances, could have resulted in a life-altering injury or death.
Most organizations classify incidents by outcome severity (first aid vs. recordable), not potential severity. This means a near miss with catastrophic potential like a worker entering a confined space without atmospheric monitoring gets filed away, while a minor laceration requiring two stitches consumes extensive investigation resources.
Start classifying every near miss and observation by its SIF potential. This single change reorients your entire safety program toward the conditions that threaten lives, not just the ones that affect your TRIR. This is the foundation of verifying your life-critical controls; ensuring the safeguards designed to prevent fatalities are actually in place and functioning, not just documented in a procedure.
Building a Reporting Culture That Raises Near-Miss Counts While Lowering TRIR
Here's a paradox that trips up many leaders: a successful TRIR reduction program will initially make your near-miss numbers go up and that is exactly what should happen.
When you build psychological safety around reporting, workers finally feel safe to report the hazards and near misses that were previously invisible. This creates a temporary spike in reported events that can alarm leadership if they don't understand the mechanism. But each reported precursor is an intervention opportunity that prevents a future recordable. Organizations with robust, blame-free reporting programs consistently see TRIR decline over 12-24 months as these precursor conditions are systematically addressed. According to the National Safety Council, such programs can reduce recordable incidents by 50-60% over three years.
This brings us to a critical warning: rate-based safety incentive programs like pizza parties for zero recordables, bonuses tied to TRIR targets actively suppress reporting. Workers learn that reporting an injury costs their team the incentive. This leads to "recordable creep," where injuries are managed through first-aid-only treatment pathways to avoid classification. This practice creates a dangerously misleading TRIR. A contractor whose TRIR dropped to 0.3 but then experienced a fatality is a stark illustration that a low TRIR achieved through reporting suppression provides no protection against serious events.
From Periodic Audits to Continuous Detection: Closing the Gap Between Hazard and Injury
The gap between a hazard forming and a recordable injury being logged is where TRIR reduction actually happens. And most organizations have no visibility into that gap.
Traditional safety programs sample this gap periodically with audits, observations, and walkthroughs. The result is that hazardous conditions like blocked emergency exits, missing PPE in high-exposure zones, unauthorized personnel in restricted areas can persist for hours or days between observations. Each is a precursor condition that exists in real time but is only discovered after an incident or during a scheduled audit.
Continuous detection closes this gap. It involves using your existing infrastructure like CCTV, sensors, and edge devices to monitor for precursor conditions in real time, across all shifts, without relying on human observers to be in the right place at the right time. 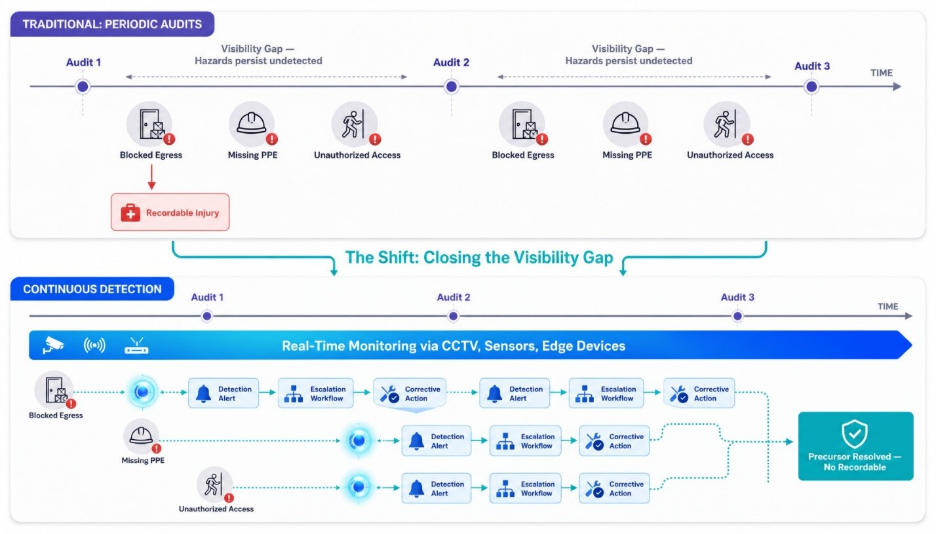
Continuous detection closes the visibility gap where most recordable injuries originate.
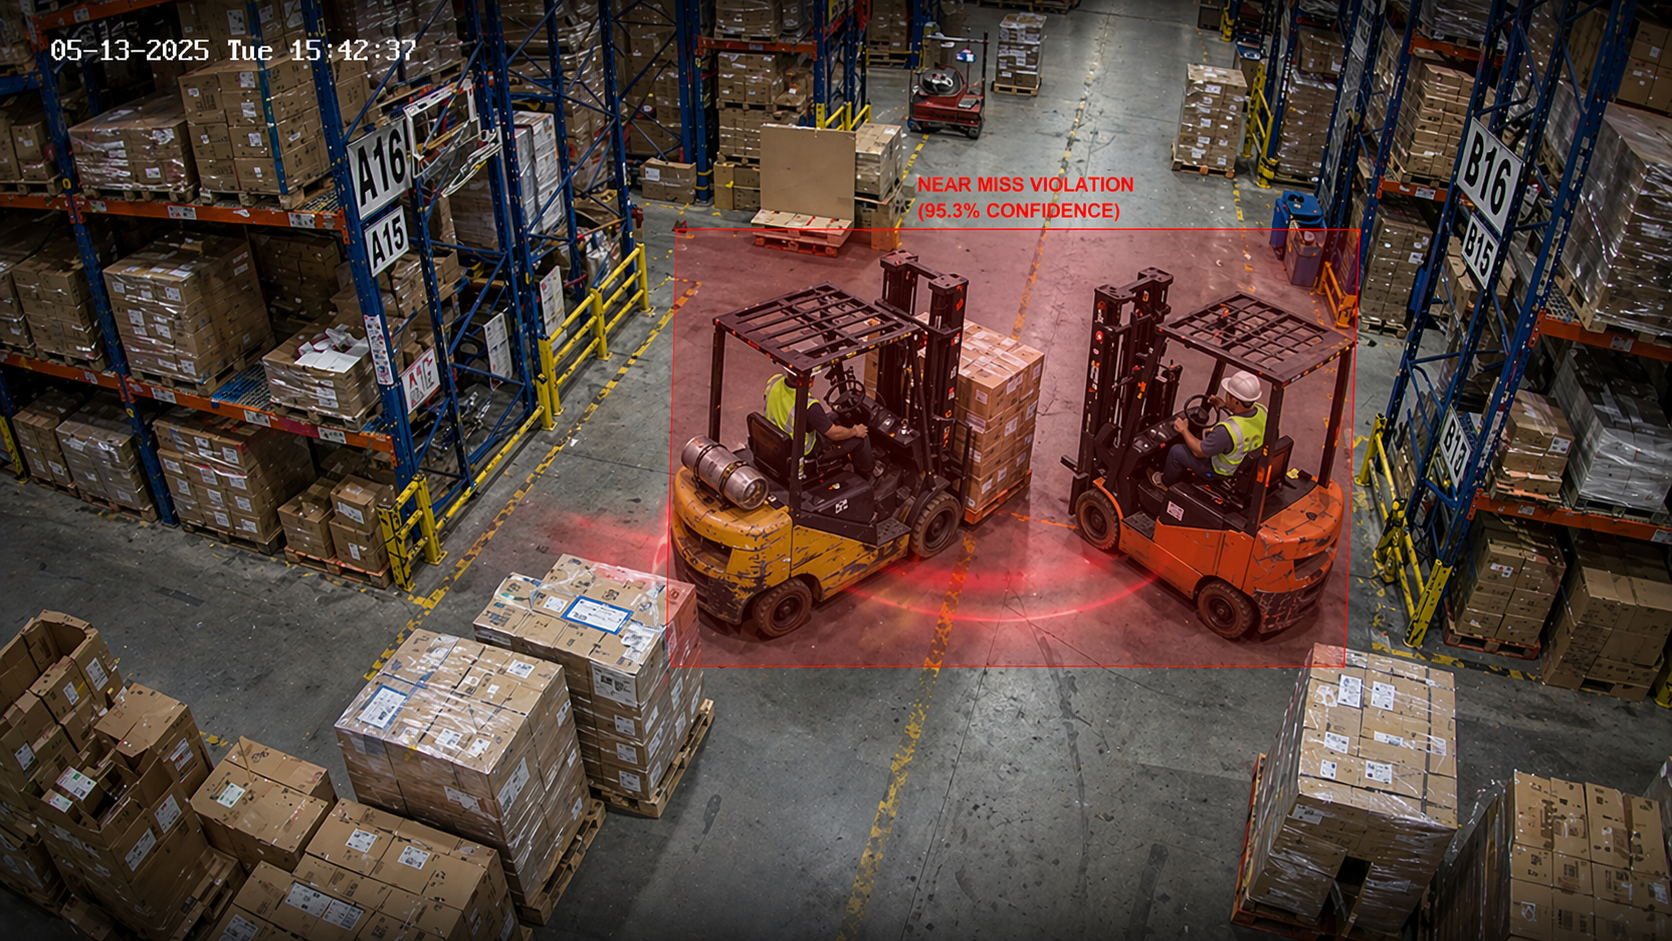
Operationally, this means a camera system that can evaluate whether an egress path is blocked by staged materials, if a worker is using a grinder without a face shield, or if a forklift is operating in a designated pedestrian-only zone. It transforms your passive recording devices into proactive safety guardians.
But this isn't a simple technology purchase. A detection alert that nobody acts on is worse than no alert at all. It's a documented failure to respond. Success depends on camera placement, lighting, model tuning for your site's specific conditions, and, most importantly, a clear, accountable workflow for escalation and response.
For a deeper industry example, the Intelligent Detection Guide for Construction shows how this kind of monitoring can be applied in complex operating environments.
How to Initiate a Continuous Detection Program
The strongest programs start by using what you already have. Begin with an audit of your existing CCTV infrastructure to identify which cameras have the right field of view, image quality, lighting, and uptime to support reliable detection. Many organizations discover they already have adequate coverage in critical areas, but they have never evaluated those feeds for safety use cases.
Next, map your highest-risk zones based on SIF potential and operational exposure. Focus first on areas where deviations are both common and consequential, such as pedestrian-forklift intersections, PPE-required production cells, loading docks, restricted access points, elevated work zones, and egress routes. The goal is not to monitor everything at once. It is to prioritize the places where earlier visibility can meaningfully reduce risk.
From there, launch a focused pilot. Choose one facility, one business unit, or a small set of high-risk zones and define a narrow set of detection objectives. For example, you might start by monitoring forklift and pedestrian separation in a warehouse cross-traffic area, face shield use at grinding stations, or blocked exits near shipping lanes. A pilot creates the baseline you need. Before trying to scale, you want to know how often precursor events occur today, when they occur, which shifts are most exposed, and how consistently teams respond once alerts are generated.
In practice, many organizations use a managed detection model to support this phase because it reduces the burden on site teams. Configuration, tuning, and performance oversight can be handled as an operational support layer, allowing safety and operations leaders to stay focused on response workflows, ownership, and corrective action.
How to Measure Whether the Program Is Working
The second metric is response time. When an alert is triggered, how quickly does the responsible supervisor, lead, or control room operator acknowledge it and take action? Detection without response does not reduce risk. Track the time from alert to acknowledgment and the time from acknowledgment to field resolution. These measures show whether the organization is operationalizing the signal or simply collecting it.
The third metric is trend improvement over time. As the program matures, the objective is a sustained downward trend in critical safety deviations in the monitored zones. If blocked exits, restricted-area entries, or PPE failures are falling month over month while response times remain fast, you are not just generating alerts. You are changing behavior and conditions before they become recordables.
It is also useful to review concentration patterns. Which hours, shifts, teams, or locations generate the most precursor events? That insight lets you target corrective action more precisely, whether that means adjusting traffic flow, changing material staging rules, reinforcing a task-specific control, or redesigning a workflow that is driving repeated noncompliance.
In practice, the most effective scorecards combine detection volume, response speed, resolution speed, and deviation trend in one view. That gives safety and operations leaders a way to evaluate whether continuous detection is increasing visibility, improving accountability, and reducing the conditions most likely to drive future recordables.
Continuous Detection in Practice
In real operations, this capability is often implemented by applying context-aware detection to existing CCTV and sensor infrastructure rather than adding new hardware to every worker or zone. The practical value comes from adapting detection models to site conditions, monitoring performance over time, and tying alerts to a response process that is actually used by operations and safety teams.
For readers evaluating what that looks like in practice, this overview of intelligent detection explains the operating model in more detail, and the contact page is available for teams that want to explore fit further.
The Most Common Mistakes That Stall TRIR Reduction
Experienced safety leaders recognize the failure modes that generic advice ignores. If your TRIR is stuck, audit your program for these common mistakes:
- Denominator Gaming: The TRIR formula can be manipulated by altering the "Total Hours Worked" denominator. Excluding contractor hours, misclassifying employees, or failing to account for all overtime can artificially lower the rate without reducing a single injury. This practice creates significant integrity risk for your OSHA 300 log and is easily flagged by auditors.
- Treating All Recordables as Equal: Investing the same investigation resources into a minor laceration and a near-miss fall from height dilutes focus. While all recordables count the same toward TRIR, their potential for future harm is vastly different. Prioritize investigations based on SIF potential, not just the actual outcome.
- Over-relying on Case Management to Reclassify Injuries: Using case management nursing relationships to aggressively steer treatment toward first-aid-only pathways is a common but dangerous practice. It lowers TRIR on paper but masks the underlying hazards, creating a false sense of security while leaving workers exposed to the risks that caused the injury in the first place.
- Setting TRIR Targets Without Leading-Indicator Targets: Telling the organization to "get TRIR below 1.0" without specifying the upstream activities (e.g., "increase SIF precursor reporting by 50%") incentivizes the wrong behavior. Without a clear path to improvement, teams will default to the easiest way to hit the number: suppressing reports.
To understand the potential return on investing in continuous detection over these flawed approaches, consider using an ROI tool to quantify the impact for your specific operation.
Conclusion
TRIR is the metric you're measured against, but it only counts what has already become a recordable injury. The standard levers of training, audits, and incident reviews are necessary, but they inevitably plateau because they operate downstream of risk formation.
Sustained TRIR reduction requires a fundamental shift in organizational energy. It means moving from managing a lagging metric to continuously detecting precursor conditions. It requires building a reporting culture that surfaces hazards before they cross the recordable threshold and focusing investigative power on events with SIF potential.
The organizations with the lowest TRIR in 2026 won't be the ones doing more of the same safety activities. They will be the ones that have built the detection and response systems that make precursor conditions visible and actionable in real time. The problem isn't insufficient safety effort; it's insufficient visibility into the conditions that precede injuries.
Frequently Asked Questions
How do you determine if a workplace injury is OSHA recordable or first-aid only?
An injury is OSHA recordable under 29 CFR 1904.7 if it results in death, days away from work, restricted work or job transfer, medical treatment beyond first aid, loss of consciousness, or a significant injury or illness diagnosed by a physician. The key threshold is "medical treatment beyond first aid". If the treatment goes beyond wound cleaning, bandaging, or non-prescription medication, the case is recordable.
Does a strong return-to-work program lower TRIR or only DART rate?
A return-to-work program primarily affects your DART rate by reducing or eliminating days away from work. It does not change your TRIR, as the injury is already recorded the moment it meets the recordability criteria. A restricted-duty assignment made under a return-to-work program is itself a recordable event, so the program helps manage severity metrics, not the initial frequency count.
What TRIR thresholds do ISNetworld and Avetta use for contractor prequalification?
Thresholds are set by the individual clients, not the platforms, and vary by industry. However, it's common for oil and gas operators to require a TRIR below 1.0, while general manufacturing or construction clients might accept a rate up to 2.5. A contractor can pass prequalification for one client and fail for another with the exact same TRIR score.
What is the relationship between TRIR and experience modification rate (EMR) for insurance?
TRIR and EMR are correlated but measure different things. EMR is calculated by your workers' compensation insurer based on your actual claims costs over a three-year period relative to your industry average; it directly impacts your insurance premiums. A high TRIR often leads to more claims and thus a higher EMR, but EMR is driven by claim cost and severity, not just frequency.
How does overtime culture inflate or deflate TRIR?
Overtime increases the "Total Hours Worked" denominator in the TRIR formula, which mathematically lowers the rate even if injury counts stay the same. A facility running heavy overtime can appear safer by its TRIR than an identical facility with the same number of injuries but fewer hours. This is why experienced safety professionals always examine raw incident counts alongside the rate.