.png?width=225&height=57&name=Untitled%20design%20(20).png)
Leading Indicators vs Lagging Indicators in Safety: Why Most Organizations Measure the Wrong Things
TL;DR
- Lagging indicators (like TRIR) measure failures that have already happened. Leading indicators measure proactive efforts to prevent those failures. A mature program needs both.
- Most organizations track the wrong leading indicators, focusing on activity volume (e.g., number of audits) instead of control effectiveness (e.g., did the audit confirm a critical control is working?).
- To predict and prevent catastrophic outcomes, focus on tracking Serious Injury and Fatality (SIF) precursors high-risk situations that could cause a fatality, regardless of the actual outcome.
- Build a balanced scorecard with 4-6 leading indicators reviewed weekly (e.g., critical control verification %) and 3-4 lagging indicators reviewed monthly (e.g., TRIR, DART rate).
- Avoid tying individual performance bonuses to leading indicator counts. This incentivizes "gaming" the numbers, which erodes data quality and masks real risk.
Leading indicators are proactive, forward-looking metrics that measure safety activities and conditions before incidents occur, while lagging indicators are reactive, backward-looking metrics that quantify outcomes injuries, illnesses, and fatalities after they happen. A robust safety management system needs both: leading indicators to drive prevention and lagging indicators to validate results.
But there's a critical failure point in how most organizations apply this model. Many believe they are tracking leading indicators when they are actually just counting activities audits completed, trainings held, observations logged. This approach tells you if your team is busy, not if your operation is safe. These metrics often function as lagging indicators with a shorter delay, reporting on compliance activities that have already passed without verifying if specific, critical controls are actually working against specific hazards.
This guide provides the definitions, formulas, and examples you need to build a stronger safety measurement program. We will distinguish between activity-based metrics and effectiveness-based metrics, introduce the SIF precursor lens that most programs miss, and provide a scorecard framework to help you move from simply reporting failures to actively preventing them.
What Are Leading and Lagging Indicators in Safety?
The fundamental distinction between leading and lagging indicators is one of timing and focus. Leading indicators are predictive and focus on prevention, while lagging indicators are historical and focus on outcomes. Understanding both is the first step toward building a system that can learn from the past while actively shaping a safer future.
Leading Indicators (Proactive)
Leading indicators are proactive, upstream metrics that measure safety activities, behaviors, and conditions designed to prevent incidents before they occur. However, a metric only qualifies as a genuine leading indicator if it measures the presence and effectiveness of a specific control against a specific hazard not merely the volume of safety activity. They are the vital signs of your safety program's health.
Examples include:
-
Safety Observation Rate: The number of high-quality safety observations submitted per 1,000 exposure hours, focusing on identifying at-risk behaviors and conditions.
-
Pre-Task Planning Compliance: The percentage of high-risk tasks that begin with a completed and verified Job Hazard Analysis (JHA).
-
Critical Control Verification Percentage: The percentage of scheduled checks on safety-critical controls (e.g., machine guarding, energy isolation) that confirm the control is present and functional.
-
Hazard Report Closure Time: The average time taken to fully mitigate a reported hazard, from identification to closure.
OSHA's 2016 recommended practices for safety and health programs strongly endorse using leading indicators to drive continuous improvement and prevent injuries before they happen.
Lagging Indicators (Reactive)
Lagging indicators are reactive, outcome-based metrics that quantify safety failures injuries, illnesses, fatalities, and their associated costs after they have already occurred. These metrics are essential for regulatory compliance and long-term trend analysis, but they cannot tell you why an incident happened or whether your next shift is safer than your last. They are the autopsy report of your safety system.
Examples include:
-
Total Recordable Incident Rate (TRIR): The number of OSHA-recordable injuries and illnesses per 100 full-time workers.
-
Days Away, Restricted, or Transferred (DART) Rate: The number of recordable incidents that resulted in an employee being unable to perform their normal duties.
-
Experience Modification Rate (EMR): A multiplier used by insurance companies to adjust workers' compensation premiums based on a company's loss history compared to its industry.
-
Lost Workdays: The total number of calendar days an employee is away from work due to a workplace injury or illness.
The data for most lagging indicators is generated from regulatory requirements under OSHA's 29 CFR 1904, which mandates the recording and reporting of work-related injuries and illnesses on documents like the OSHA 300 Log.
|
Attribute |
Leading Indicator |
Lagging Indicator |
|
Timing |
Proactive (before an incident) |
Reactive (after an incident) |
|
Purpose |
To predict and prevent failures |
To measure and report on failures |
|
Data Source |
Observations, audits, inspections, sensor data |
Incident reports, OSHA logs, workers' comp claims |
|
Actionability |
High; enables immediate intervention |
Low; identifies problems that already occurred |
|
Limitations |
Can be harder to measure; vulnerable to "gaming" |
Tells you nothing about future performance or near-misses |
|
Example |
Percentage of corrective actions closed on time |
Total Recordable Incident Rate (TRIR) |
Examples of Leading and Lagging Safety Indicators With Formulas
The value of any indicator depends on its connection to the specific hazards and critical controls within your operation. A PPE compliance score is a vital leading indicator in construction but is less relevant for a healthcare facility focused on preventing patient falls. The key is to select a mix of metrics that provide a complete view of your risk landscape.
Expanded Leading Indicator Examples by Industry
Beyond the basics, a mature program tracks a diverse set of leading indicators that reflect both system performance and employee engagement. According to ISO 45001 Clause 9.1, organizations must establish processes for monitoring, measurement, analysis, and performance evaluation that are relevant to their specific risks.
Common Leading Indicators:
-
Safety Observation Cards Submitted: Tracking not just the count, but the quality score of observations and the percentage that identify a previously unknown hazard.
-
Percentage of Corrective Actions Closed on Time: Measures the organization's responsiveness to identified risks.
-
Management Safety Walk Frequency: The number of scheduled, high-quality safety tours conducted by leadership to engage with frontline workers.
-
Stop Work Authority Utilization Rate: The number of times employees exercise their authority to halt a task due to perceived safety risks. A low number might indicate a culture of fear, not a safe operation.
-
Employee Safety Perception Survey Scores: Anonymous survey data that measures the strength of the safety culture from the frontline perspective.
|
Industry |
Recommended Leading Indicator 1 |
Recommended Leading Indicator 2 |
|
Construction |
Pre-task JHA Completion Rate |
Fall Protection Equipment Inspection Compliance % |
|
Manufacturing |
Machine Guarding Verification Rate |
Lockout/Tagout (LOTO) Audit Pass Rate |
|
Oil & Gas |
Permit-to-Work Compliance Score |
IOGP Life-Saving Rules Observation Frequency |
|
Healthcare |
Patient Fall Risk Assessment Completion % |
Needlestick Prevention Device Availability |
Read more: Intelligent Detection Guide | Construction | Rainscales
Expanded Lagging Indicator Examples With Formulas
Lagging indicators are standardized and form the basis of regulatory reporting. Workers taking OSHA 10-hour or 30-hour training learn to recognize how incidents contribute to these metrics, which are derived from the OSHA 300 Log.
Common Lagging Indicators:
-
Total Recordable Incident Rate (TRIR):
Formula: (Number of OSHA-recordable incidents × 200,000) ÷ Total hours worked
Example: A facility with 5 recordable incidents and 500,000 employee work hours has a TRIR of 2.0. (5 × 200,000) / 500,000 = 2.0 -
Days Away, Restricted, or Transferred (DART) Rate:
Formula: (Number of incidents with days away, restricted, or transferred × 200,000) ÷ Total hours worked -
Severity Rate: Measures the severity of injuries by tracking the number of lost workdays.
Formula: (Total number of lost workdays × 200,000) ÷ Total hours worked -
Fatality Rate: The most severe lagging indicator, often calculated per 100,000 workers.
-
Experience Modification Rate (EMR): A comparison of your workers' compensation claims history to other employers in your industry. An EMR of 1.0 is the industry average.
-
Cost Per Claim: The average direct cost associated with each workers' compensation claim.
Why Most Leading Indicator Programs Measure Activity, Not Effectiveness
Consider this common scenario: a manufacturing plant proudly reports 500 safety observations per month, 98% safety training completion, and 12 management safety walks per quarter. On paper, their leading indicator dashboard is glowing. Then, a worker suffers a serious crush injury at a machine where the energy isolation procedure had been informally and routinely shortcut for months.
The program failed because it measured activity, not effectiveness. The observations counted that an observation was made, not whether the critical lockout/tagout control was actually being followed. The training metric confirmed attendance, not comprehension or application. The walks were completed, but they didn't verify the one control that mattered most for that hazard.
This is the central flaw in many safety programs: they track activity-based leading indicators (volume metrics that count how many times a safety task was done) instead of effectiveness-based leading indicators (quality metrics that verify if a specific critical control is functioning as intended).
Campbell Institute has highlighted, distinguishing meaningful indicators from "check-the-box" metrics is paramount. When organizations incentivize observation counts or audit completion rates, they get quantity without diagnostic value. The metric becomes a lagging indicator of compliance activity rather than a leading indicator of hazard control.
The shift to effectiveness requires a focus on critical control verification. This moves the core question from, "Did we do the inspection?" to "Is the control present, functioning, and sufficient for the hazard it is supposed to manage?" Frameworks like bow-tie analysis, which map specific hazards to their preventive and mitigative controls, make this type of verification possible. Until your leading indicators can answer that second question, your dashboard might be telling you you're busy, not that you're safe.
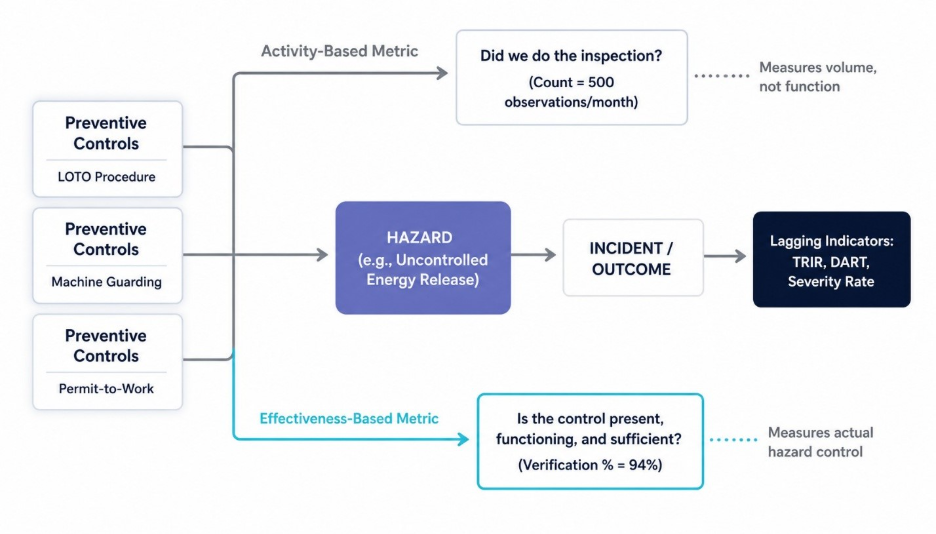
Effective leading indicators verify control function, not just activity completion.
Read more: AI Intelligent Detection & Computer Vision Guide | Rainscales
How to Build a Balanced Safety Scorecard With Leading and Lagging Indicators
A balanced safety scorecard pairs 4-6 leading indicators focused on critical control effectiveness with 3-4 lagging indicators focused on outcome trends, reviewed at different cadences. Leading indicators should be reviewed weekly or even per-shift to enable early intervention, while lagging indicators are best reviewed monthly or quarterly to identify stable trends.
This approach aligns with the principles of ANSI/ASSP Z10, the American national standard for Occupational Health and Safety Management Systems, which emphasizes an integrated, data-driven process. To build this capability, organizations typically progress through three stages of maturity.
Safety Measurement Maturity Model:
- Level 1 (Reactive): The organization tracks only lagging indicators like TRIR and DART. The monthly safety review consists of discussing last month's incident reports and assigning blame. The focus is entirely on past failures.
- Level 2 (Proactive): The organization tracks both leading and lagging indicators, but the leading indicators are primarily activity-based (e.g., number of trainings). The safety review discusses both incident trends and activity completion rates. The focus is on compliance and benchmarking.
- Level 3 (Predictive): The organization's leading indicators are dominated by SIF precursors and critical control verification metrics. The monthly safety review focuses on which critical controls were verified, what SIF precursors were identified, and what system changes were implemented in response. Lagging indicators are used as a final validation, not the primary signal.
-
Sample Level 3 Balanced Scorecard Structure:
Leading KPIs (Reviewed Weekly): -
Critical Control Verification %: Target >95% successful verifications on scheduled checks.
-
SIF Precursors Identified: Target is not a number, but a trend of high-quality reporting.
-
Corrective Action Close-Out Rate (within 30 days): Target >90%.
-
Positive Safety Contact Rate: Number of high-quality, non-punitive safety conversations held by supervisors.
-
Stop Work Authority Utilization: Review each instance as a system learning opportunity.
-
Lagging KPIs (Reviewed Monthly/Quarterly):
-
TRIR & DART Rate: Benchmark against industry and historical trends.
-
Severity Rate: Monitor to ensure minor incident reduction isn't masking high-severity potential.
-
Experience Modification Rate (EMR): Annual review to assess long-term financial impact.
From Counting Activities to Verifying Controls in Real Time
The primary challenge in moving to a Level 3 scorecard is the difficulty of continuously verifying critical controls at scale. Manual observations are episodic, subjective, and labor-intensive. This is where intelligent detection systems provide a clear operational advantage.
By leveraging an intelligent detection platform organizations, can transform existing CCTV, sensors, and edge devices into a continuous critical control verification engine. Instead of relying on a safety observer to periodically check a site, the platform can evaluate multiple conditions in a single camera view such as posture, location, PPE presence, and zone rules to generate leading indicator data that reflects the actual status of your controls in real time. This moves you from counting completed checklists to verifying that, for example, an exclusion zone is respected or that energy isolation procedures are being followed moment-to-moment.
When delivered as a managed service, intelligent detection providers handles the model configuration, tuning, and ongoing improvement. This ensures your leading indicator data remains calibrated as site conditions and policies evolve, directly addressing the data quality and gaming problems that undermine traditional programs. You get the operational clarity needed to manage risk proactively, using the infrastructure you already own.
See how Rainscales turns existing infrastructure into continuous critical control verification
The Gaming Problem: When Leading Indicator Incentives Erode Safety Culture
-
It's a pattern many of us have seen. A site manager is told that the number of submitted safety observations is a key performance indicator (KPI) tied to their annual bonus. Within two months, observation volume doubles. But a closer look reveals the observations have become shorter, less specific, and far less likely to identify actual hazards. The metric improved; the safety insight degraded.
This is a textbook example of Goodhart's Law: "When a measure becomes a target, it ceases to be a good measure." This dynamic is especially dangerous with leading indicators, whose entire purpose is to provide an early warning. If the data is inflated or "gamed" to meet a target, the early warning system is compromised, and the organization develops a blind spot to emerging risk.
To protect the integrity of your leading indicator program, two countermeasures are essential:
-
Measure Quality Alongside Quantity: Never track a volume metric in isolation. Pair "number of observations" with "percentage of observations that identified a SIF precursor" or "percentage of observations that led to a corrective action." This shifts the focus from quantity to diagnostic value.
-
Decouple Data from Individual Incentives: Use leading indicator data for system learning, not for rewarding or punishing individuals. This aligns with Human and Organizational Performance (HOP) principles, which treat operational data as a source of insight into system weaknesses, not a tool for performance management.
SIF Precursors: The Leading Indicators That Actually Predict Catastrophic Outcomes
-
For decades, safety management was guided by the Heinrich safety triangle, which proposed that reducing minor injuries would proportionally reduce serious ones. However, extensive research on Serious Injuries and Fatalities (SIF) has shown this assumption to be flawed. Organizations can successfully drive down their TRIR while their exposure to a catastrophic event remains unchanged or even increases. The causal pathways for high-severity events are simply different from those for slips, trips, and minor cuts.
This is why a mature safety program must focus on SIF precursors: high-risk events or conditions with the potential to cause a serious injury or fatality, regardless of whether the actual outcome was minor or a near-miss.
Examples of SIF precursors include: -
A worker entering a permit-required confined space without atmospheric testing being completed and verified.
-
A crane lifting a load over a live work area where personnel have not been cleared.
-
A maintenance technician bypassing a critical safety interlock on a piece of machinery to save time.
-
A fall protection anchor point that fails an annual inspection but remains in service.
Tracking SIF-potential events as a primary leading indicator reframes your entire safety program around consequence severity rather than incident frequency. This aligns with the HOP tenet that error is normal and that operational systems must be designed to fail safely to absorb human error without a catastrophic outcome. Industry frameworks like the IOGP's Life-Saving Rules in oil and gas are a direct operationalization of this thinking. Your TRIR trend line tells a story about the past; your SIF precursor log tells you about your exposure to a life-altering event on the very next shift.
From Reactive Reporting to Proactive Prevention
The distinction between leading and lagging indicators is a foundational concept in safety management. But the more consequential distinction for any operations leader is between leading indicators that measure activity volume and those that verify whether critical controls are preventing serious harm. A safety program that counts observations, trainings, and audits without relentlessly asking, "Is this control working against this hazard?" is operating with a dashboard full of green metrics and a blind spot where the next serious injury lives.
The organizations that will meaningfully reduce their SIF exposure in the coming years are those that stop treating leading indicators as a compliance exercise. They will start treating them as a continuous, evidence-based verification system whether that evidence comes from disciplined field observations, real-time sensor data, or intelligent AI detection.
Frequently Asked Questions
Can lagging indicators still be useful in a modern safety program?
Yes, absolutely. Lagging indicators remain essential for regulatory compliance (OSHA 300 Log, 29 CFR 1904), benchmarking against industry peers, and validating whether leading indicator improvements are translating into actual outcome reductions. The mistake is not in using them, but in using them as the primary signal for safety program health rather than as a confirmation layer.
How do you convince leadership to invest in leading indicator tracking?
Frame the business case around risk reduction and cost avoidance, not activity volume. Show leadership the potential cost of a single SIF event including regulatory penalties, litigation, operational shutdowns, and reputational damage versus the investment in continuous critical control verification. Use lagging indicator data they already trust, like workers' comp costs or EMR trends, to demonstrate that reactive measurement alone has not reduced their exposure.
What is the relationship between near-miss reporting and incident prevention?
Near-miss reports are valuable only when they are investigated for SIF potential and result in system-level corrective actions. A high near-miss reporting rate with no follow-through is an activity metric, not a prevention mechanism. The diagnostic question is: what percentage of near-miss reports led to a meaningful change in a critical control or operating procedure?
What is the difference between activity-based and outcome-based safety metrics?
Activity-based metrics measure whether a safety task was performed (e.g., "Was the inspection completed?"). Outcome-based metrics measure the result of that task (e.g., "Did the inspection identify a control deficiency, and was it corrected?"). Most organizations default to activity-based metrics because they are easier to collect, but they provide a much weaker predictive signal for incident prevention.
What technology platforms help track leading safety indicators in 2026?
EHS software platforms like Intelex, Enablon, Benchmark Gensuite, Velocity EHS, and Sphera are effective for managing structured data collection, like audits and observations. For real-time, continuous leading indicator generation such as PPE compliance, zone violations, and critical control verification AI computer vision platforms that work with existing CCTV and sensor infrastructure are increasingly used to supplement manual programs.
How do you determine the right review cadence for leading versus lagging indicators?
Leading indicators should be reviewed weekly or even per-shift because their value is in early detection and rapid intervention; a monthly review defeats the purpose of a proactive metric. Lagging indicators should be reviewed monthly or quarterly because they require enough data volume to distinguish real trends from statistical noise. SIF precursor events, however, should be reviewed immediately upon identification.